 I've long praised the value of Redfin for tracking the ups and downs of the real estate market. I named the site my number one Web service of 2010, after telling you how it did so well for us that we practically single-sourced our home search last Spring and Summer on the site. Even after our home purchase, I've kept frequent watch on Redfin, and they're showing home sales dropping and prices falling in a cold winter market.
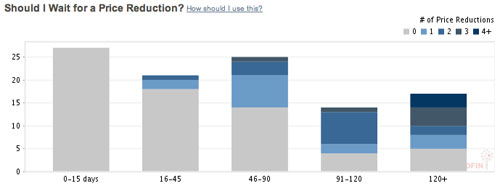
But they take the trend beyond that of a gut feeling, now offering users the option to dive deep into local trends, by zip code, to see trends, recent sales, and even give tips on whether you should wait a few months for the price to drop.
Redfin Shows Weak Winter Market for Local Sales
Watching my own home, just in the last month, the price has dropped by about $30k (according to Zillow). For the 30-year mortgage owner, this shouldn't be a big deal, but it's indicative of what's happened in our particular part of the Bay Area. Redfin said January was chilly for both sellers and buyers, as activity was on pause before the usual seasonal ramp-up for spring and a busy summer. But they insightfully noted price drops on the West Coast with other parts of the country being "mixed." It's no wonder my nightly emails from Redfin on sales haven't filled me with good thoughts of late.
Browsing Redfin By Zip Code Provides Significant Detail
As a new feature to their standard map search, Redfin now offers statistics by zip code, anywhere they operate. For example, if you try Mountain View (94303) or Belmont (94002), you can scan market activity for the area, including:
- New Homes for Sale
- Upcoming Open Houses
- Price Reduced
- Recently Sold
- Most Expensive
- Least Expensive
- Most Popular
Redfin Shows Data on Price Reductions Over Time
As more communities become supported by Redfin and the company starts to follow and aggregate more statistics, there becomes real potential for the site to act as a data-rich barometer for a critical part of the economy. For every Web wonk professing a "bubble" and an imminent crash, it's clear that the financial world has a lot more work to do. Redfin's seeing the way it really is, down to your zip code. Try yours.


